The Most Brutal Single-Month Plunge in 43 Years, Gold's Every Top Looks Like This


In January this year, gold reached a historic high of $5,589. In less than two months, the price dropped to around $4,100, experiencing a peak-to-trough decline of 26.6%, marking the most severe monthly drop in 43 years.
The direct transmission chain of this sharp drop is not complex. Into the third week of the US-Iran conflict, the Strait of Hormuz was blocked, causing oil prices to rise by over 40% since the outbreak of the conflict. According to data from the US Bureau of Labor Statistics, the February CPI reached a new high since last year, coupled with the lagging effects of high tariffs, fueling market concerns about inflation. In the latest Summary of Economic Projections (SEP), the Federal Reserve narrowed its interest rate cut expectations for 2026 to only once, essentially announcing the end of the recent easing cycle. The US Dollar Index broke through the 100 mark, exerting comprehensive pressure on precious metals and base metal prices.
However, the macro narrative is only half the story. According to Finance Magnates analysis, the technical breakdown of the 50-day moving average (around $4,978) triggered a concentrated stampede of "crowded long positions," with cascading stop-loss and margin call orders being activated. Gold rose from $2,600 to over $5,000 within 12 months, with a large amount of leveraged funds accumulating in long positions. When the escalation of the conflict drove up oil prices instead of gold prices, these crowded positions became the first chips to be sold off.
The price drop itself is not the story. The story is: this "geopolitical shock driving inflation, concentrated unwinding of leveraged trades" script has played out at least three times in the past 46 years.
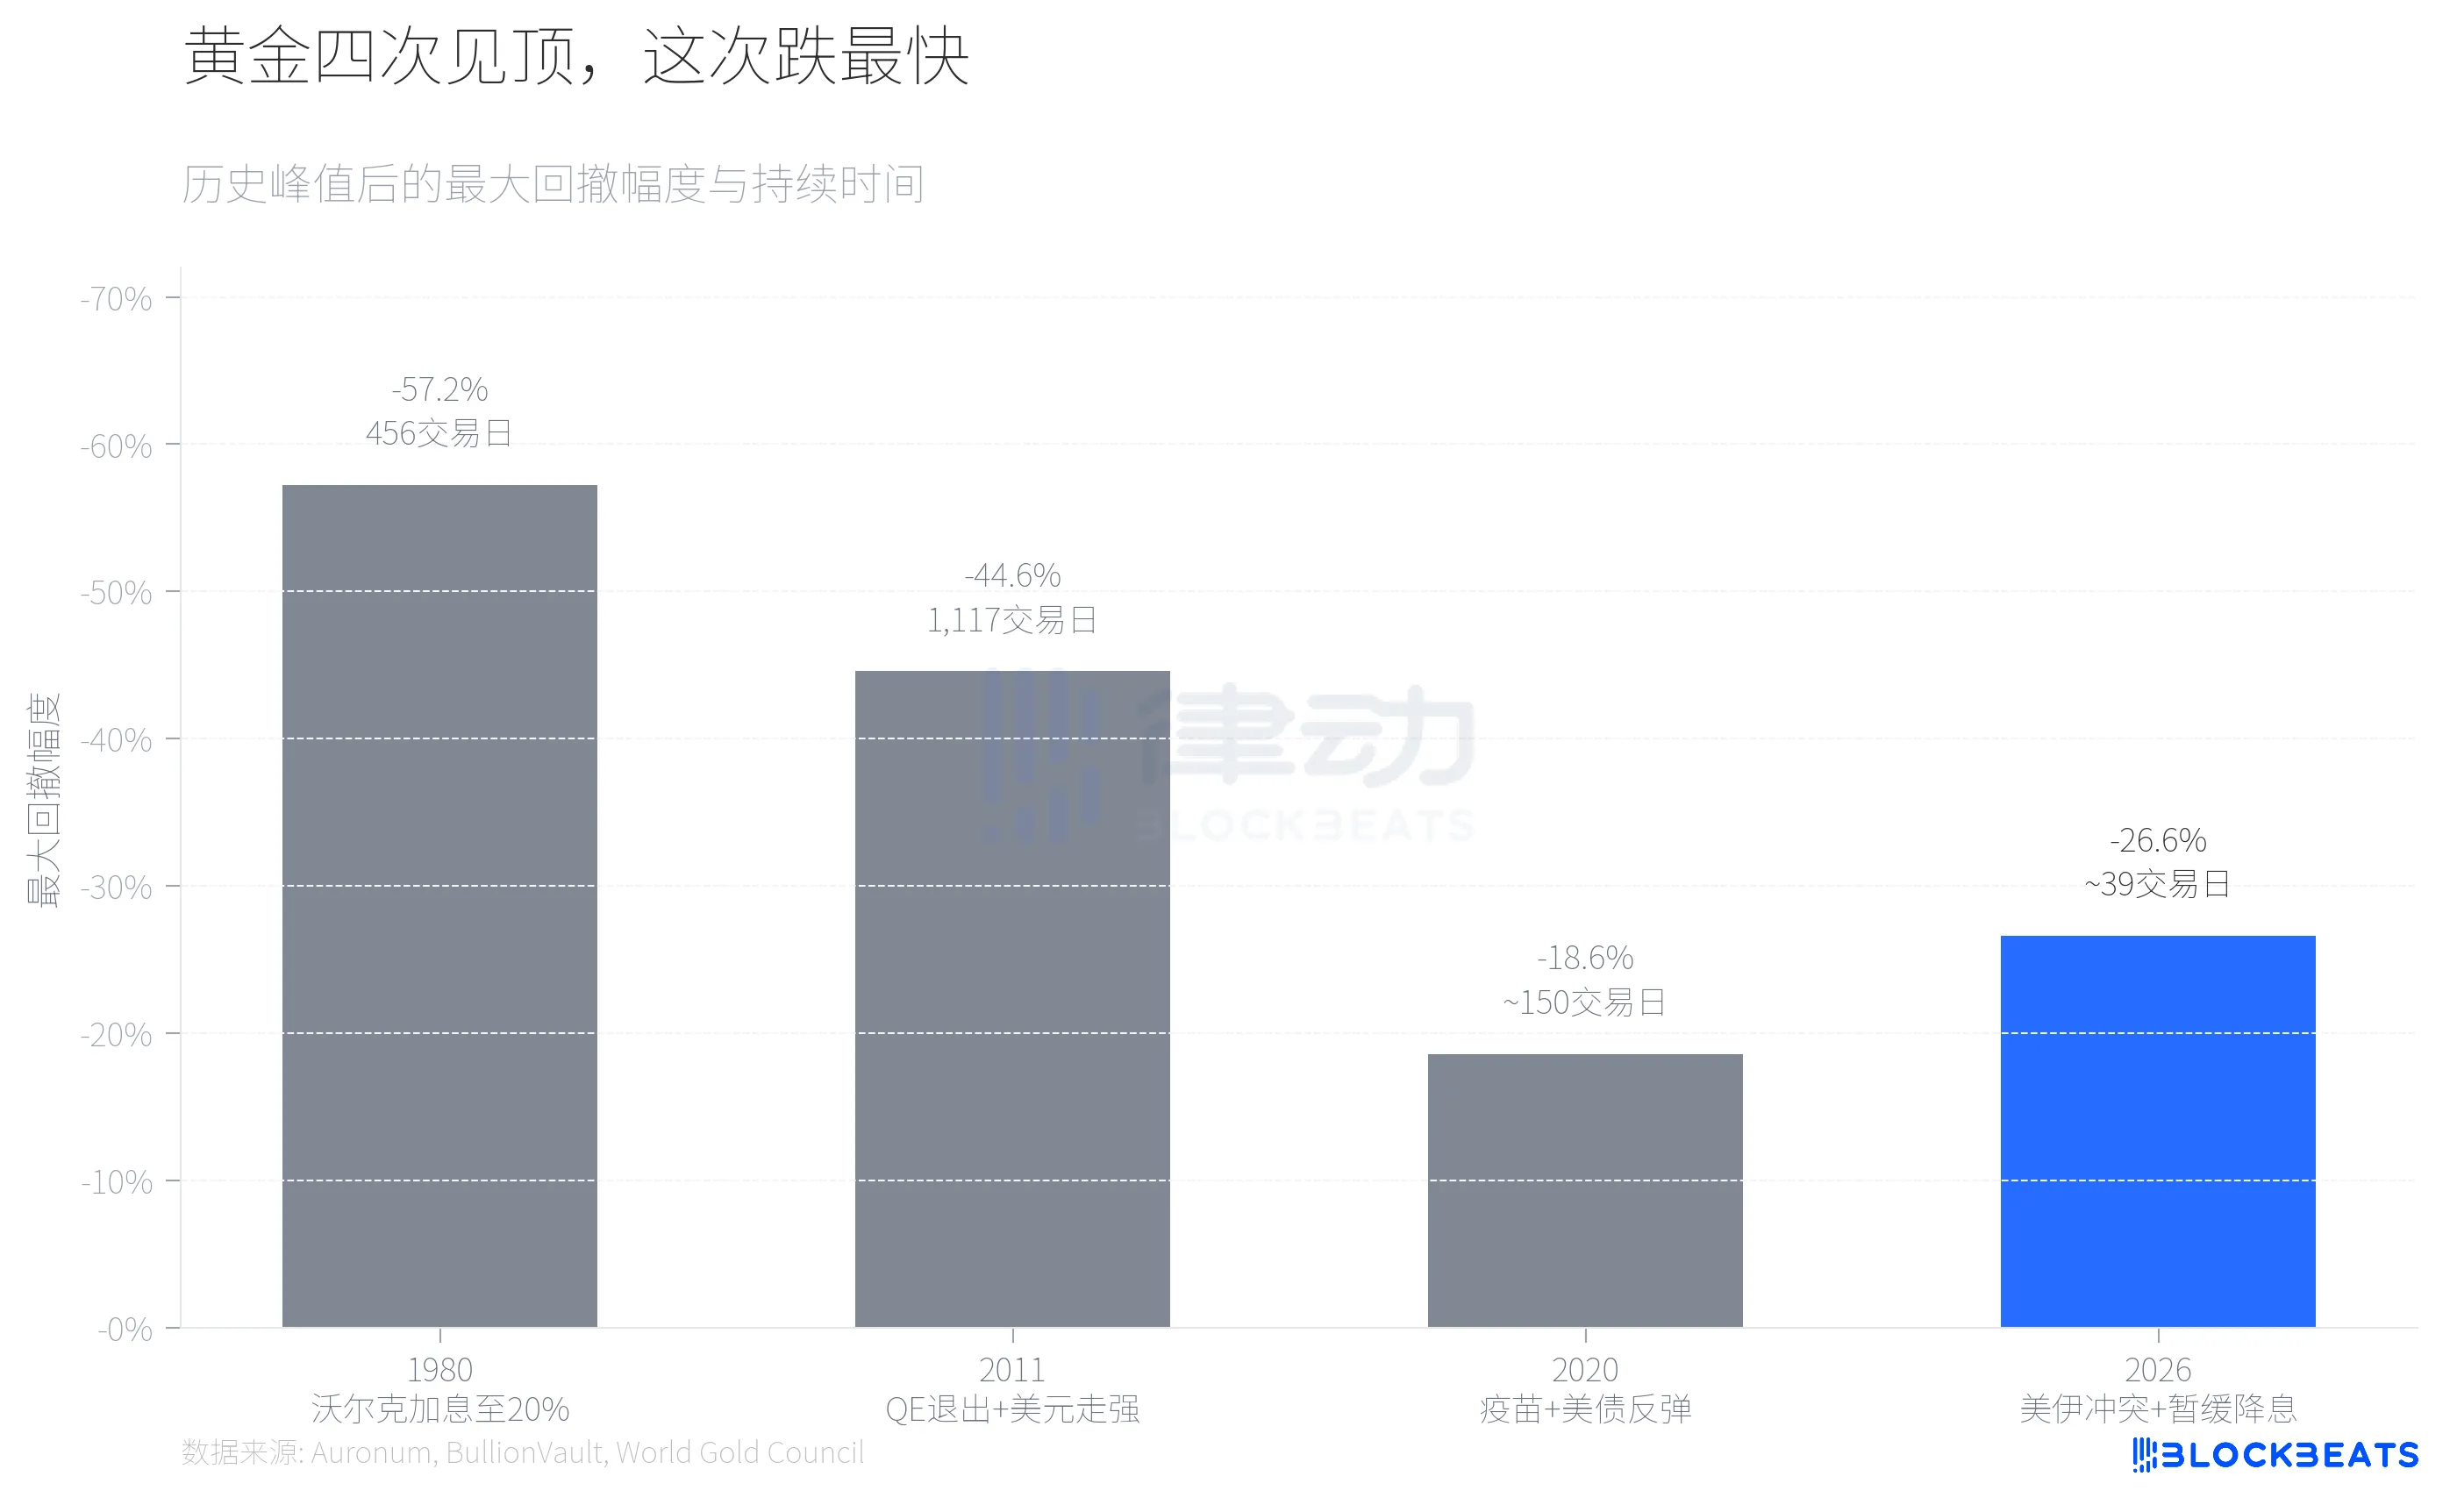
According to historical data compiled by the precious metals analysis firm Auronum, in 1980, Volcker pushed the federal funds rate to 20%, gold dropped from a peak of $711 to $304, a 57.2% decline, taking 456 trading days. In 2011, amid expectations of QE exit and a strengthening dollar, gold fell from $1,999 to $1,049, a 44.6% decline, taking over 4 years. The pullback in 2020 was milder, with vaccine rollout and a rebound in US bond yields causing gold to fall 18.6% from a peak of $2,067, but resuming its upward trend 7 months later.
The pullback in 2026 is currently around a 27% decline, exceeding that of 2020 and approaching that of 2011. However, in terms of speed, it is the fastest of the four.
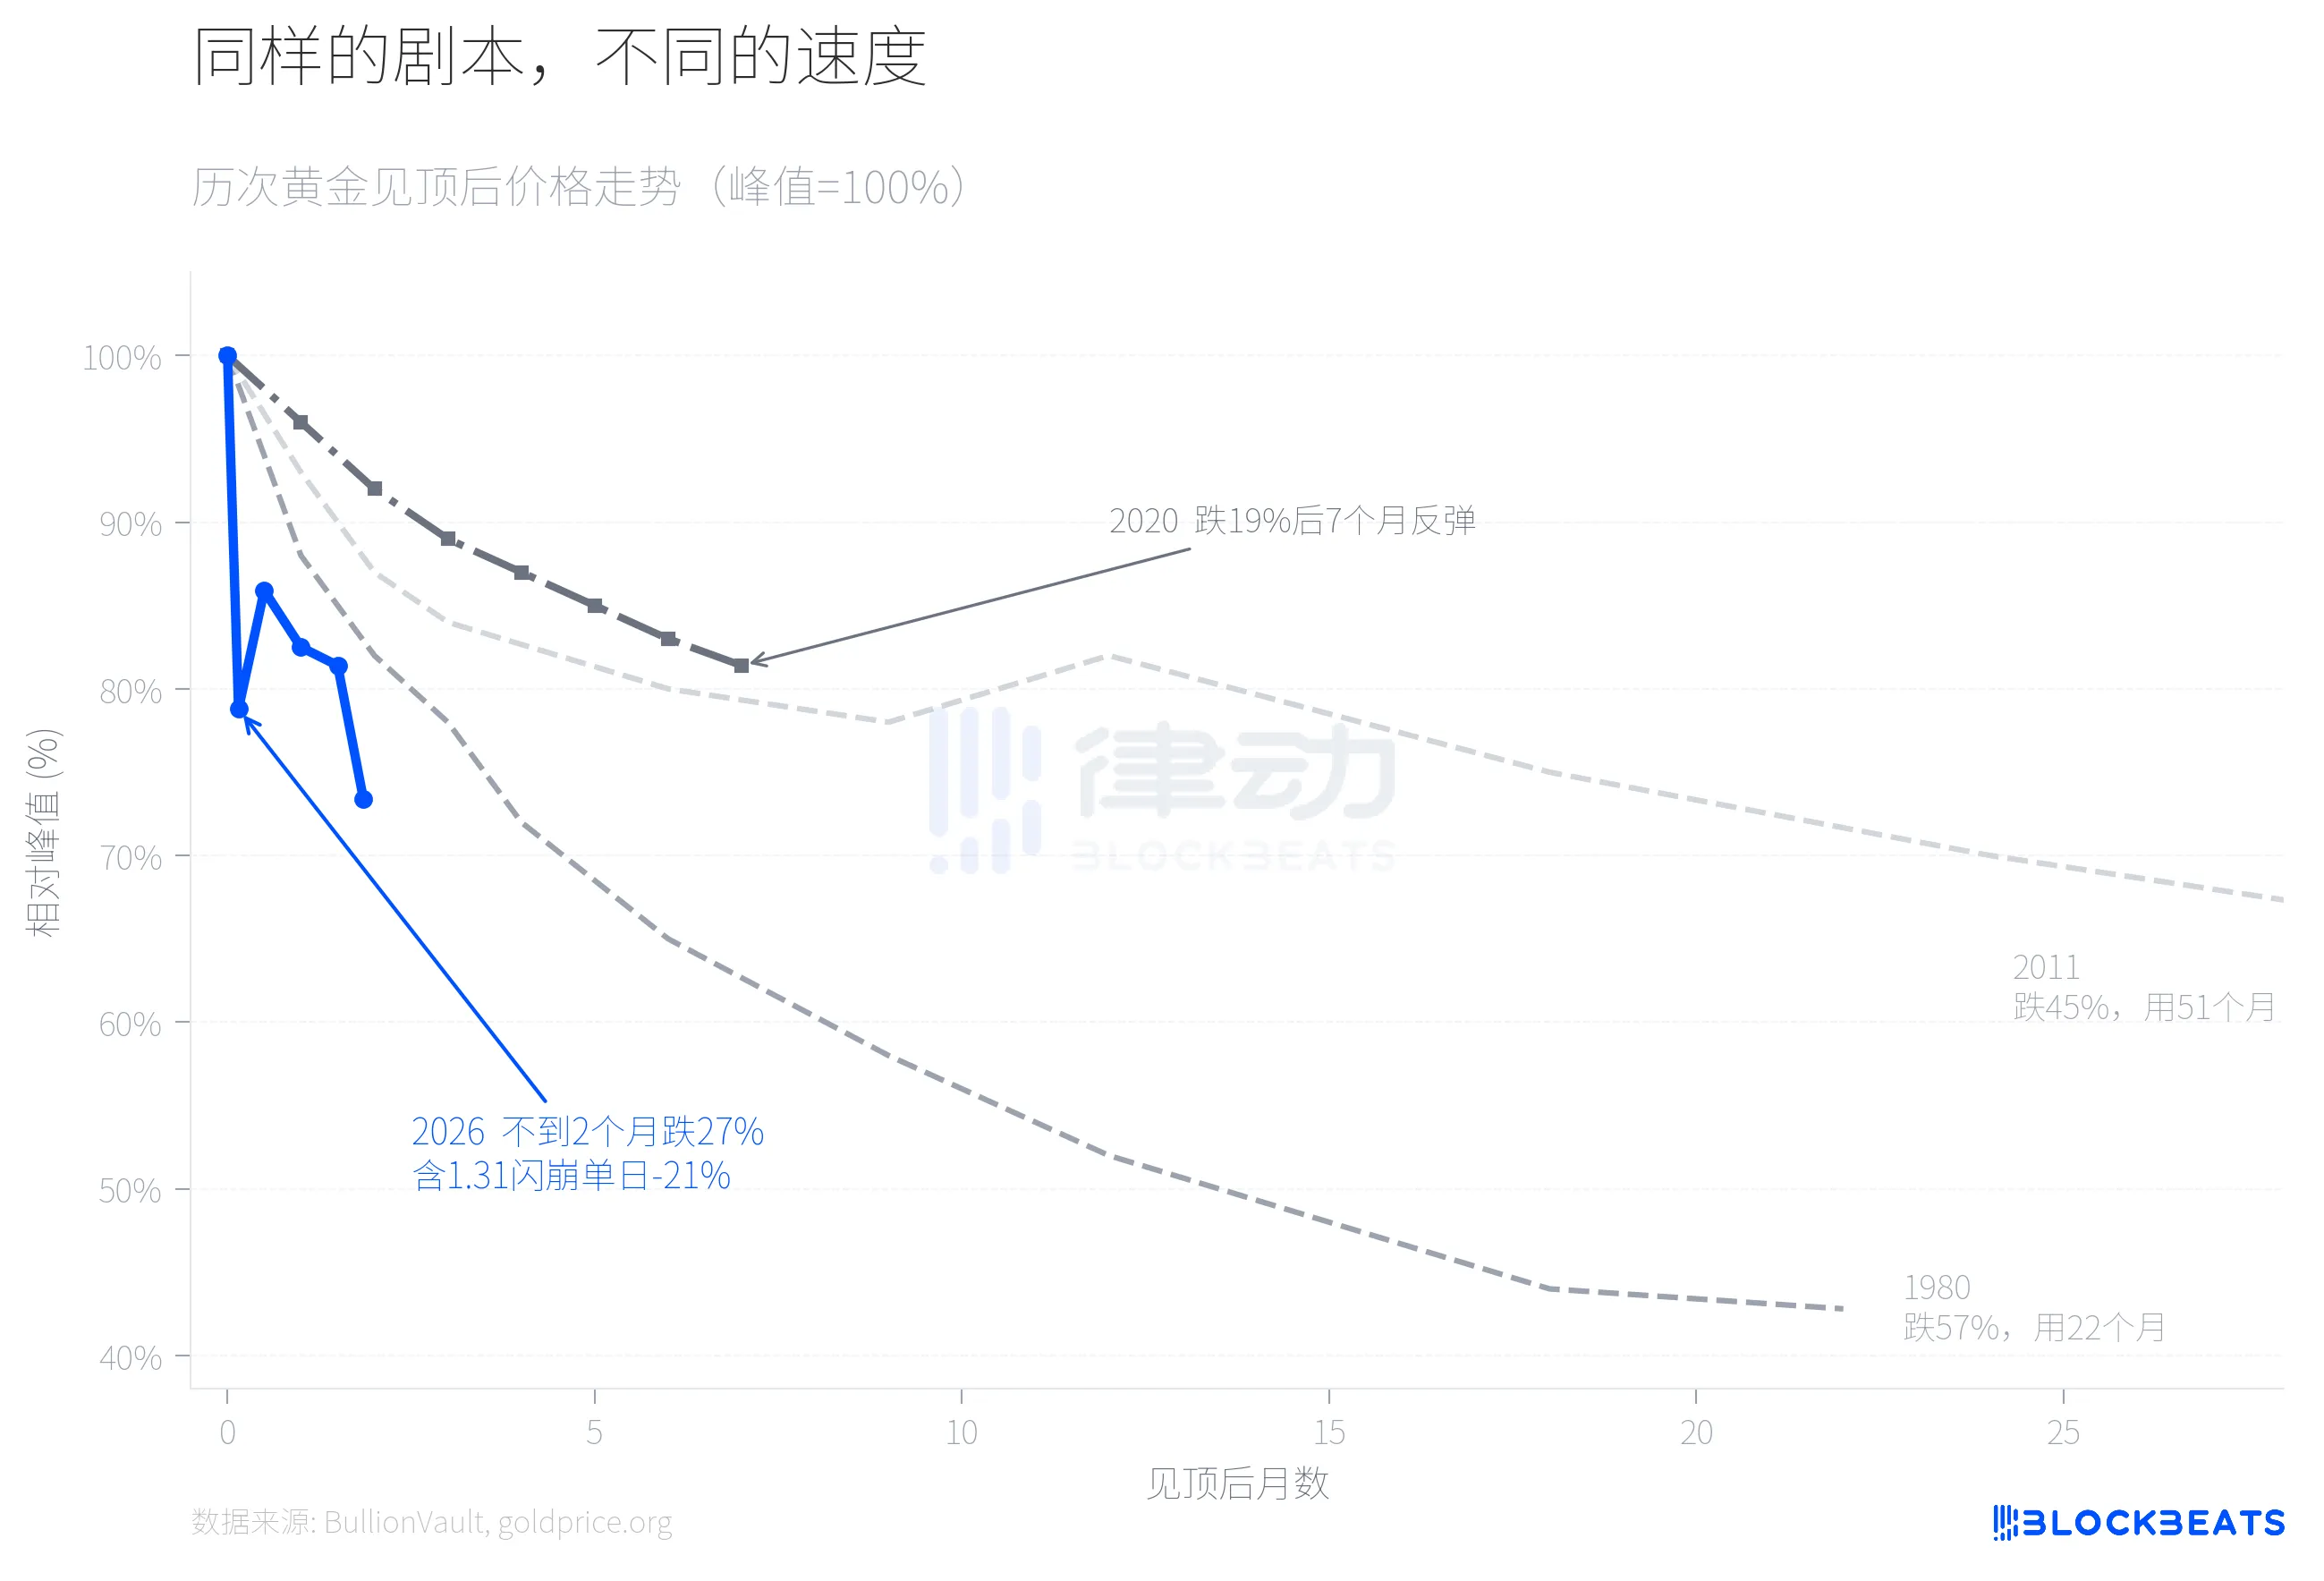
Overlaying the price trends of the four pullbacks, the differences are clear. In 1980, it took nearly two years to complete the major decline, and in 2011, it took over four years. In 2026, the gold price completed a 21% retracement on the 5th trading day after peaking, followed by a brief rebound, but accelerated its decline to around $4,100 in the third week of March, expanding the cumulative decline to 27%. The flash crash on January 31 was a turning point. According to data from the world's largest precious metals trading platform BullionVault, gold fell more than 10% that day, silver plummeted 13.7%, and the iShares Silver ETF (SLV) saw trading volume exceed $40 billion, ranking it as one of the largest single-day trading volumes in US securities history. Former ICBC Tokyo Precious Metals Business Director Bruce Ikemizu commented that, having observed this market for 40 years, he has "never seen this level of volatility before."
Why Was This Speed So Abnormal? One key variable was CME's shift on January 13 to a contract value percentage margin system from a fixed amount for COMEX. According to CME Group data, gold futures margins were raised from 8% to 9%, and silver from 15% to 18%. In a rapidly rising market, a percentage margin system means that as prices increase, the required margin also increases, creating a self-reinforcing deleveraging mechanism. As reported by goldsilver.com, over 67 million ounces of silver paper contracts were forcibly liquidated within minutes on the day of the flash crash.
Silver's performance was one dimension that was overlooked in this round of plummeting.
In April 2025, the gold-silver ratio briefly exceeded 100:1, with silver significantly lagging behind gold. Silver then saw a surge, achieving a full-year gain of 147% (compared to gold's 67%) after hitting a peak of 121.67 USD per ounce, bringing the ratio down to around 46:1, the lowest level since 2013.
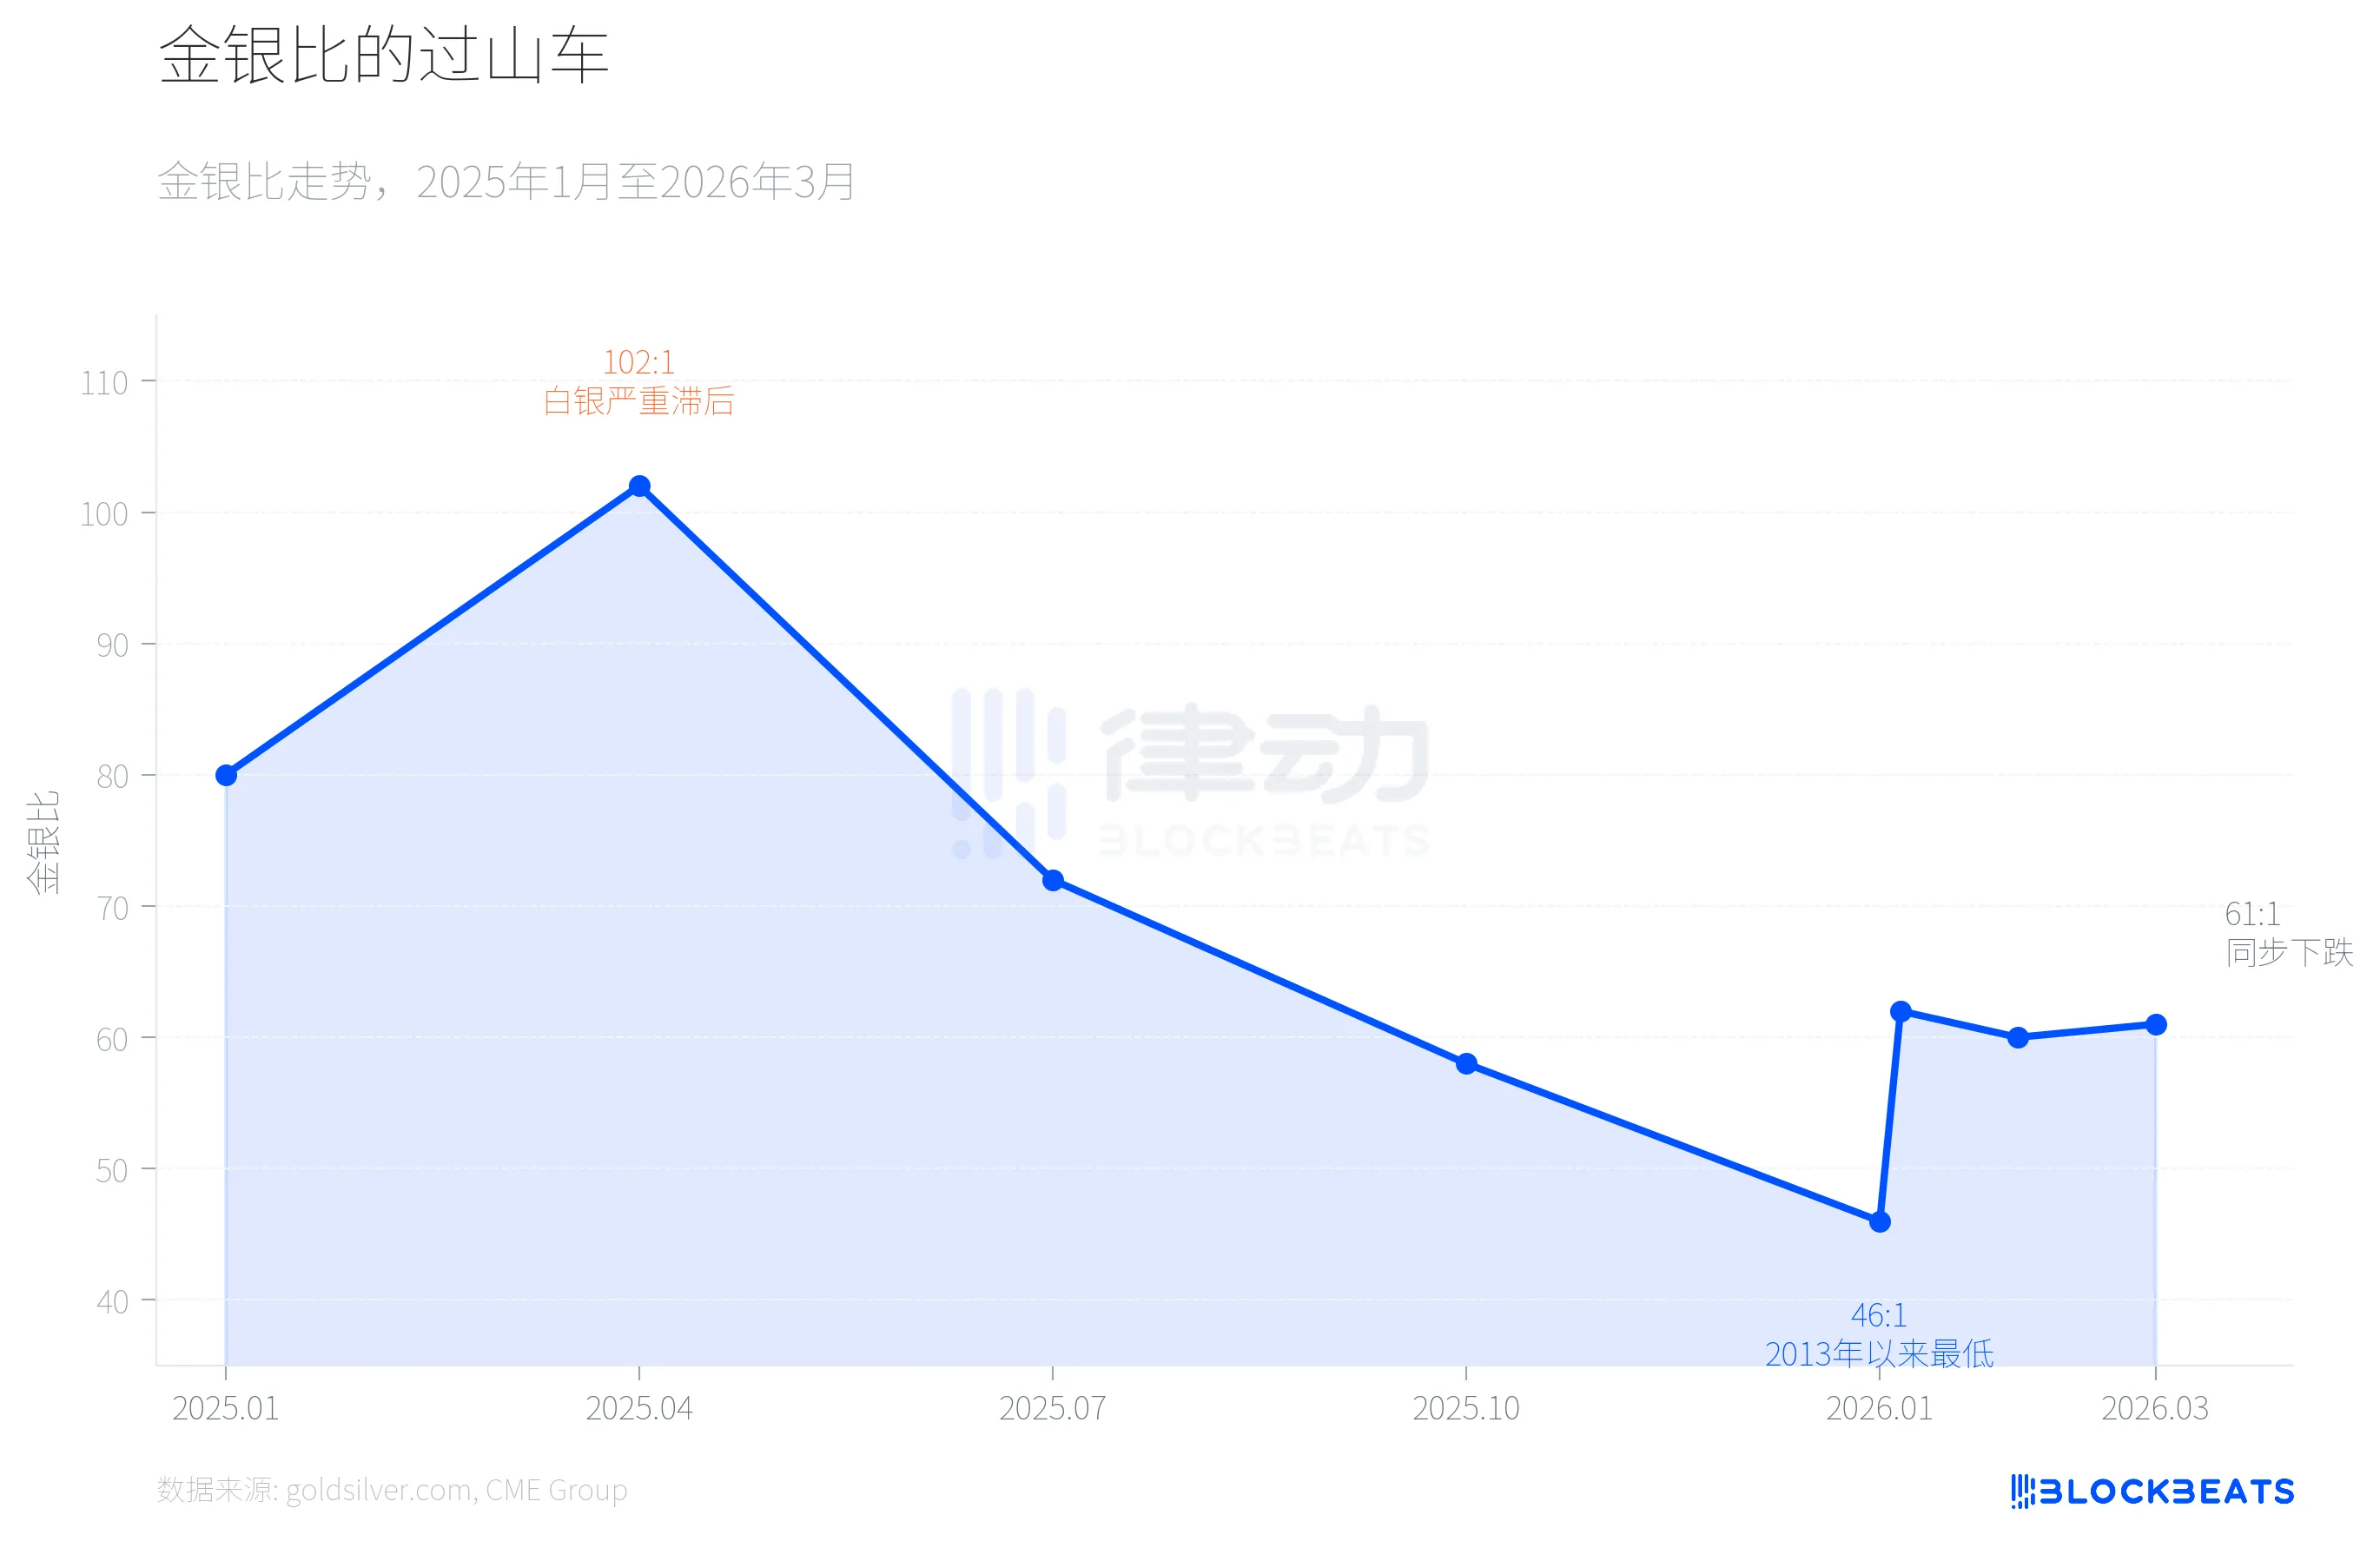
Then everything reversed on January 31. According to data from that platform, silver experienced a one-day drop of 13.7%, with a cumulative decline reaching 41.1% from the peak of 121.67 USD, far exceeding gold's 26.6% during the same period. This was a rare precious metal one-day swing not seen since the 1980 Hunt Brothers incident ("Silver Thursday"). As of March 23, silver was trading around 67.4 USD, and the gold-silver ratio had rebounded from its low of 46:1 to around 61:1. The rally in silver that took 9 months to materialize was mostly wiped out in less than 2 months.
The core reason for this asymmetry lies in silver's dual nature. On one hand, according to a CME Group research report, solar panel capacity grew by 18% YoY, indicating silver's industrial demand is still structurally expanding. On the other hand, the leverage ratio in the silver market is much higher than in gold, and CME's margin increase from 15% to 18% directly triggered large-scale liquidation. The industrial fundamentals remained unchanged, but the financial leverage broke first.
The last signal worth noting is the divergence in fund structure.
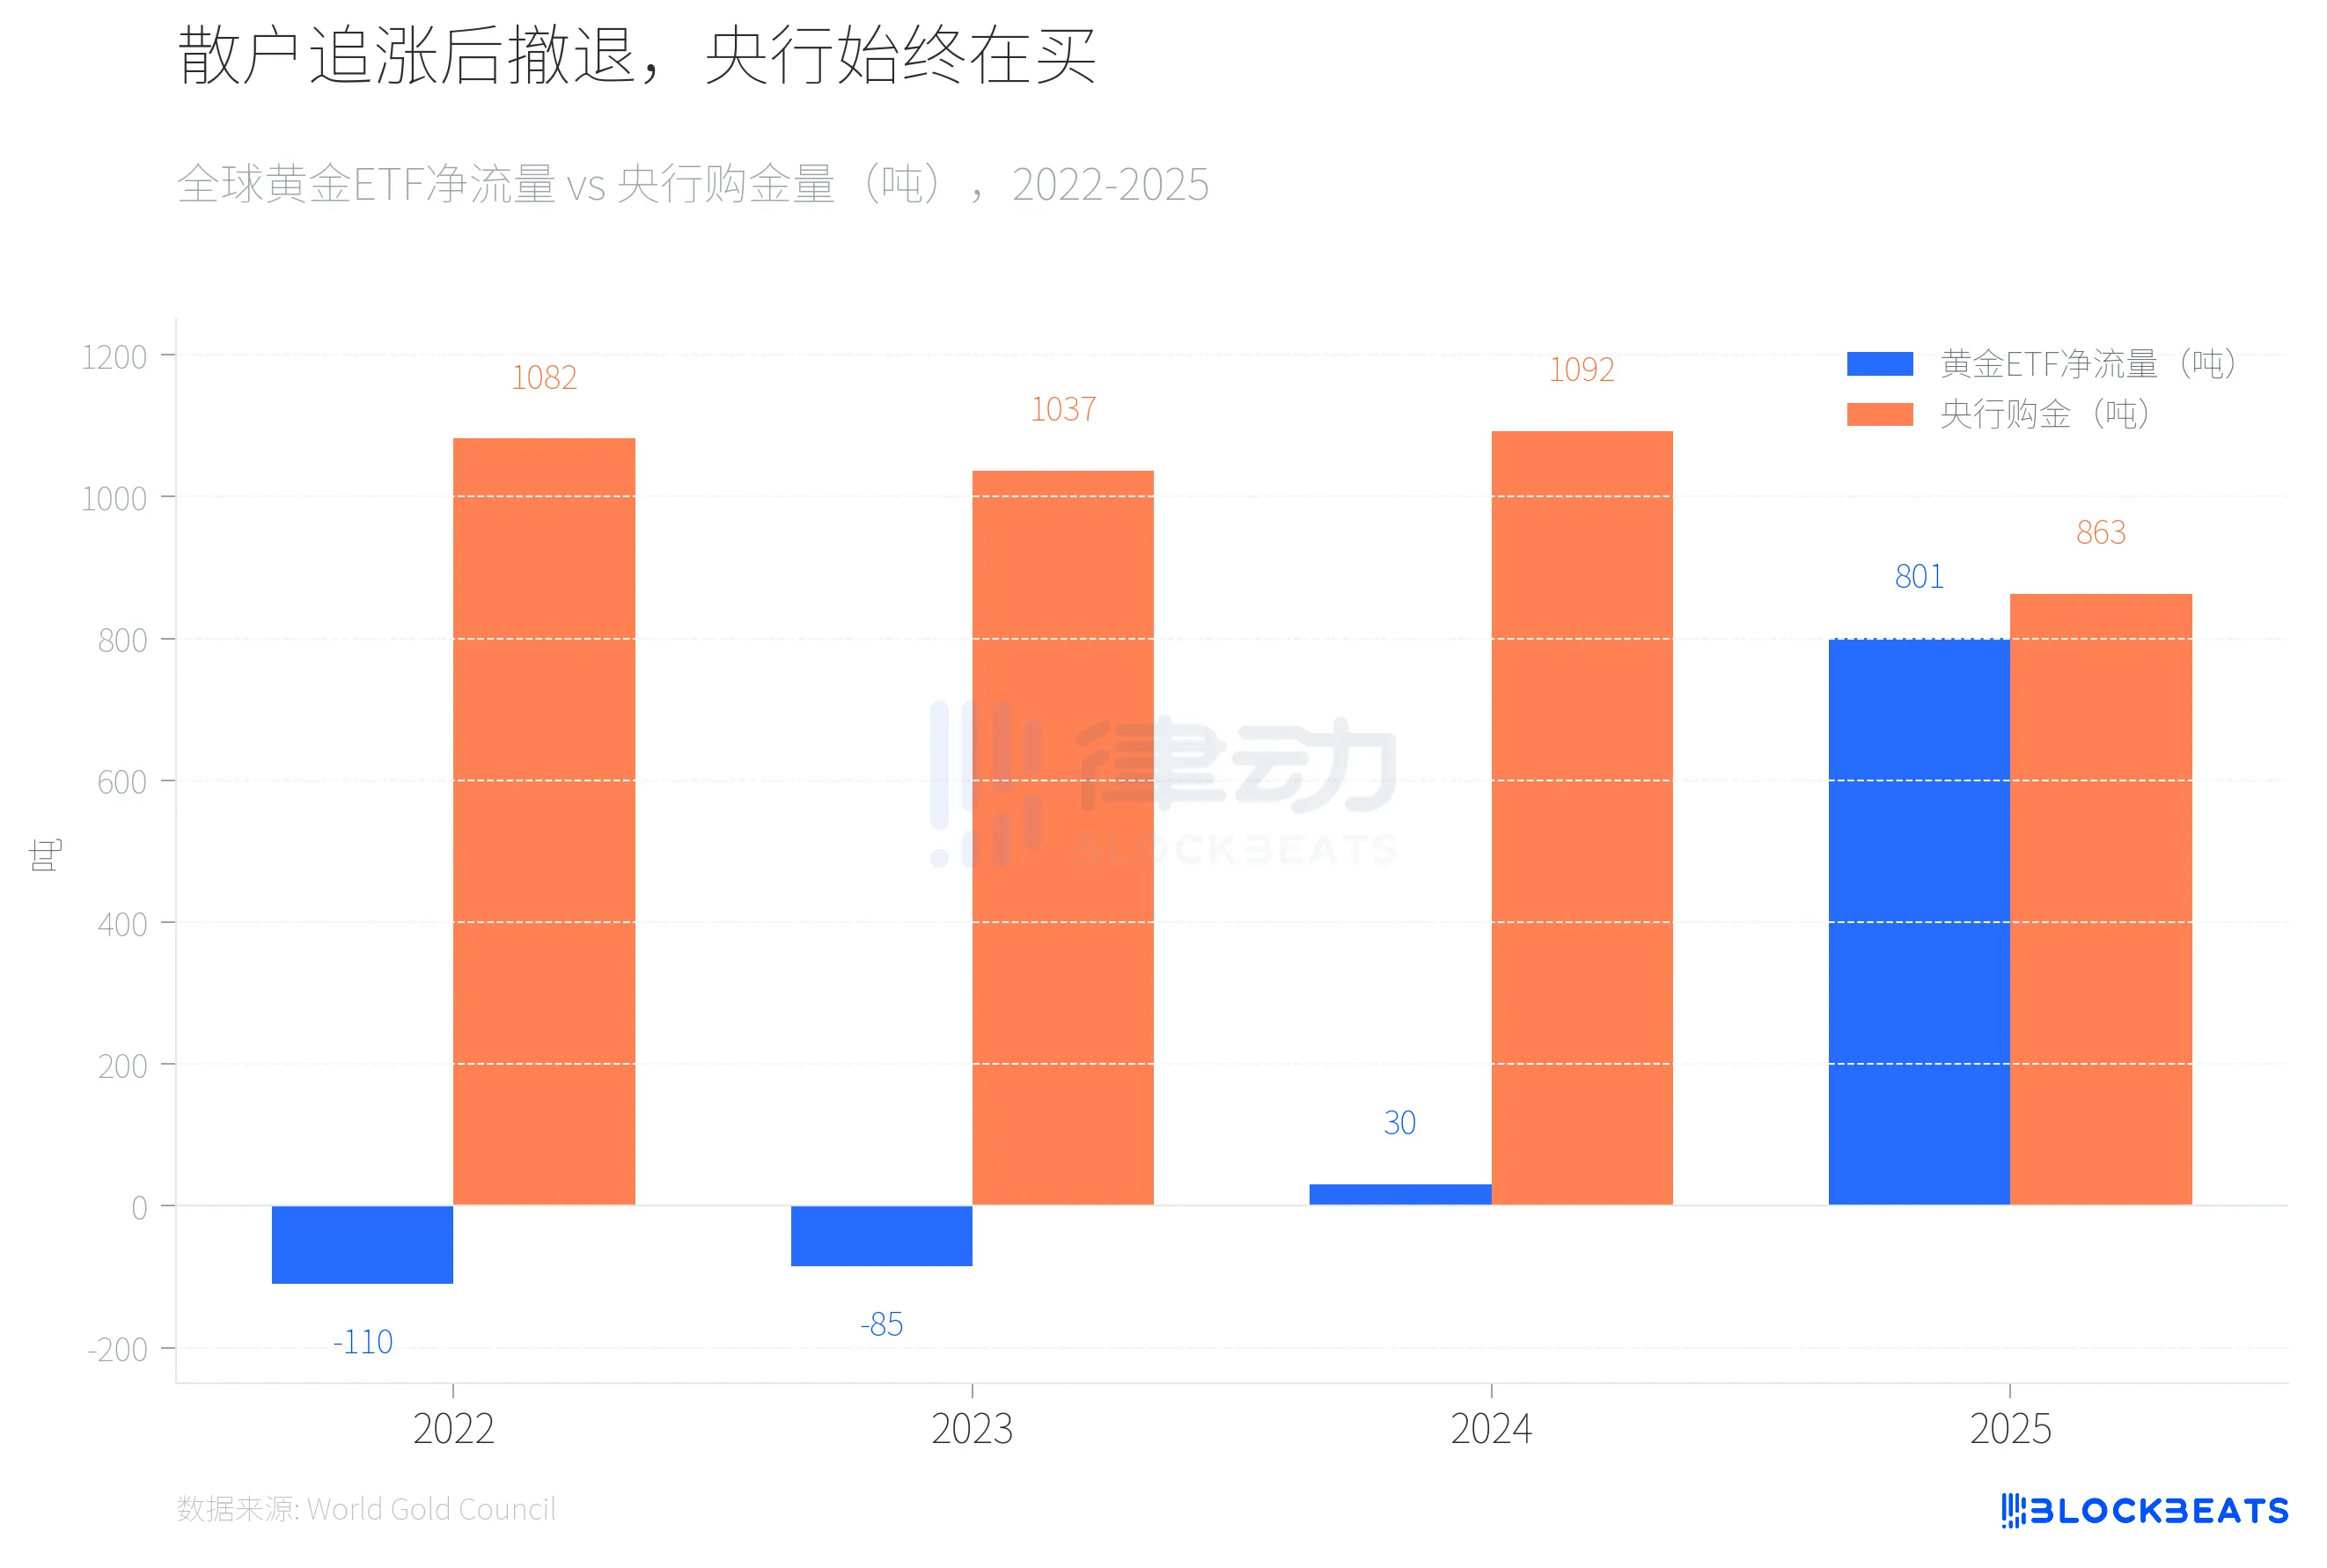
From 2022 to 2023, global gold ETFs saw two consecutive years of net outflows (-110 tons and -85 tons, respectively), while central bank gold purchases exceeded 1,000 tons for two consecutive years. In 2024, ETF funds turned positive but on a small scale (30 tons), while central banks continued their high-level purchases at 1,092 tons. The situation dramatically changed in 2025; based on World Gold Council data, global gold ETFs saw a record net inflow of 801 tons for the full year, doubling their assets under management to $559 billion.
Then the retail money started running. According to the Canadian business media Chronicle Journal, the SPDR Gold Trust (GLD) saw a single-day net outflow of $2.91 billion on March 4, marking the largest single-day outflow since 2016, with 25 tons of gold lost in 7 days. Meanwhile, according to the institution's annual report, global central banks bought 863 tons of gold by 2025, a 21% decrease from 2024 but still well above the 2010-2021 average level (473 tons). The same report shows that the Polish central bank, with a purchase volume of 102 tons, became the world's largest buyer for the second consecutive year, followed closely by Kazakhstan (57 tons) and Brazil (43 tons).
According to a March research report by J.P. Morgan, the bank maintains its year-end 2026 gold price target of $6,300. However, according to the IEA's March Oil Market Report, the blockade of the Strait of Hormuz has led to a global oil supply reduction of about 8 million barrels per day, equivalent to nearly 8% of global demand. The IEA called it the "largest supply shock in the history of the global oil market," with member countries initiating the largest-ever 400 million-barrel release from strategic reserves.
For central banks of oil-importing countries, the priority of dealing with oil price shocks may be higher than continuing to increase their gold holdings. In the previous three peaks, global central banks were not net buyers of gold. They bought 863 tons in 2025, but no one knows the number for 2026 yet.
You may also like

Why is a16z Crypto raising another $2.2 billion to heavily invest in Web3?

Polymarket Underlying Algorithm Explained

What do projects born in the crypto bear market do?

a16z founder's Stanford lecture: Whenever Wall Street and Silicon Valley have different ideas, it's Wall Street that ends up being wrong

Michael Saylor: After three consecutive quarters of losses, Strategy will sell Bitcoin to pay dividends

The toll station at Hormuz and the RMB that cannot be bought

Interview with Coinbase Institutional's Strategic Head: The Institutionalization of Crypto Reaches a Critical Point

Dialogue with Agora CEO Nick: The battle for stablecoin licenses has just begun

Morning Report | a16z Crypto completes $2.2 billion fundraising for its fifth fund; Bullish invests $4.2 billion to acquire share transfer agency Equiniti; PayPal's Q1 performance exceeds expectations

a16z Crypto: What We See Behind the $2.2 Billion New Fund
Web3 is dead, Web2+3 should rise
Stablecoins and Latin American Remittances: The Misunderstood $174 Billion Market

The arrival of the Web 3.0 era: A review of Hong Kong court rulings on digital assets

Track Markets At a Glance: New WEEX Price Widgets for iOS & Android
To streamline your market data access, WEEX has officially launched "Market Watchlist" desktop widgets

The billion-dollar lesson: The focus of DeFi security is shifting from code to operational governance
A Brief Analysis of Stablecoin Licenses and On-Chain Funding
BVNK Founder: Three Stages of Stablecoin Development
