On-Chain Whale Tracking: Accumulation or Distribution?
Original Article Title: "Link Whale Behavior - Who's Buying, Who's Selling? Data Reveals the Truth!"
Original Article Author: Murphy, On-Chain Data Analyst
After receiving comments from friends in the community, requesting an analysis of Link's data, as the leader in oracles and a high market cap altcoin, Link's on-chain data is much richer than what we have seen with ENA or PEPE. Due to my lack of in-depth research into the project's technical ecosystem, I can only approach this from a data perspective and cannot provide a comprehensive research report.
Alright, in this edition, let's talk about Link. Our starting point is Link's large wallets; observing whale behavior is a key focus of on-chain data analysis. For Link, we must also face the reality that whales have already conducted large-scale profit-taking from December 2024 to January 2025.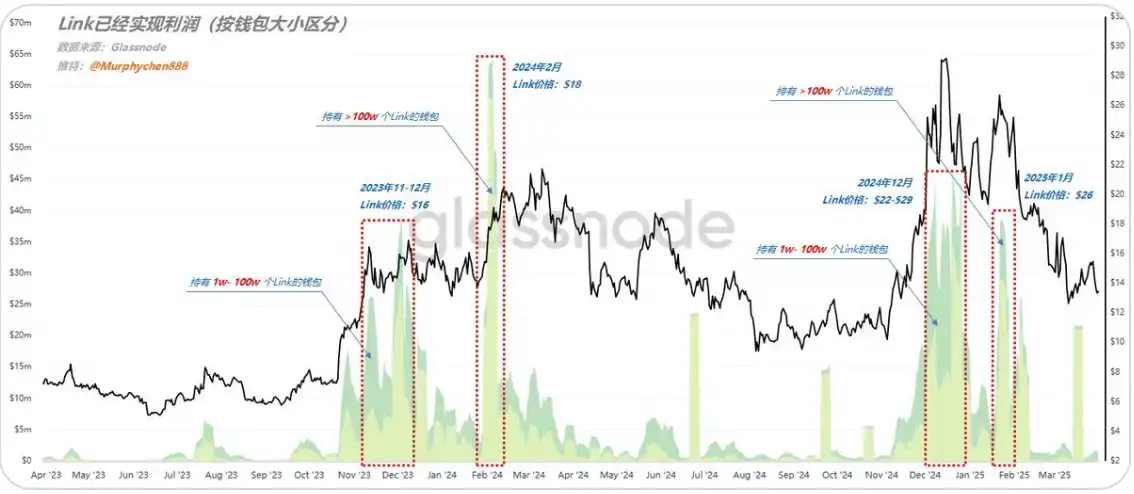
(Figure 1)
As shown in Figure 1, every time the Link price experiences a rapid increase, wallets holding 10k to 1M Link (high-net-worth group) and wallets holding>1M Link (whale group) both see very high peaks of realized profits. Additionally, in each major trend, the 10k to 1M group tends to sell off in large volumes first, followed by the>1M group starting to cash out, leading to a subsequent price peak and decline.
For example:
1. In November-December 2023, the trend was led by the 10k to 1M group, with Link priced around $16; in February 2024, the trend was led by the>1M group, with Link priced around $18;
2. In December 2024, once again, the trend started with the 10k to 1M group cashing out intensively at Link prices between $22-$29; subsequently, in January 2025, the>1M group started cashing out intensively, with Link priced around $26.
It is evident that these sell-offs occurred near interim highs. When the market cannot absorb such a large distribution of chips, a peak naturally forms.

(Figure 2)
Looking at the current distribution of circulating chip holdings, the amount of Link held by whales (>1M) is steadily decreasing. In the bear market of May 2022, whales held 786m Link, and by March 2025, this number had decreased to 669m. This indicates that more Link is moving to relatively smaller wallets, meaning chip concentration is decreasing.
Looking back at historical data, from 2018 to 2021, Link was in a high chip concentration phase. After May 2022, the chip concentration has been on a declining trend, and it is unknown whether this means that Link is gradually transitioning from the previous "strong market maker control" mode to a "community consensus" mode.

(Figure 3)
The three lines in Figure 3 represent:
1. Line1 (deep green) - Average turnover cost of the high net worth group; currently at $15;
2. Line2 (black) - Link-RPC, i.e., overall chip average turnover cost; currently at $12;
3. Line3 (light green) - Average turnover cost of the whale group; currently at $10;
The current Link price is below Line1 but above Link-RPC, indicating that there are still a significant number of chips in a floating profit state, keeping the overall turnover cost above the average. In this respect, Link outperforms the data performance of most altcoins. For example, as we saw in the previous period with ENA, the current price is already below ENA-RPC.
During the bear market consolidation phase, the price of Link has always been below Line3, meaning that at this time, the whale group is on average in a floating loss state, and each rebound encounters resistance at the Link-RPC line. When the price rises above Line1, it means that Link has sounded the horn of the bull market's major uptrend.
From August 2024 to November, Link also experienced a long bull market retracement period. It can be seen that the price has always remained above Line3, so whenever it touches the whale group's cost line, the selling pressure decreases. Therefore, if we assume that this bull market cycle has not yet ended, when the Link price is below Link-RPC but above Line3, it may be the limit of the retracement ($10-$12).
Once the price falls below Line3 and the rebound cannot break through Link-RPC, there is a risk of entering a long-term bear market.
(Figure 4)
Finally, let's take a look at the chip structure changes of Link in the past three years and recently. During the consolidation period from November 2022 to October 2023, a large chip accumulation zone was formed around $6-$7. By March 2024, when the Link price surged to $20, this chip accumulation zone gradually disappeared, indicating that the chips accumulated at the lower levels were gradually sold off at the higher levels.
Afterwards, following a price retracement in July 2024 to November 2024, LINK continued to consolidate, forming a new accumulation zone with an average cost of around $12-$13. A portion of these holdings were gradually sold off as the price surged to $26-$28 between December 2024 and January 2025.
However, two whale groups' positions are worth noting: one group accumulated 39 million LINK around October 2024 at a cost of around $12, while another group also accumulated 17 million LINK around November 2024 at a similar cost. Regardless of the price surging to $28 and then dropping back to $12, these two whale groups did not sell their holdings; instead, they continued to accumulate at different times.
The former group increased their holdings in a phased and rhythmic manner; they added substantially to their position in December 2024 (at prices of $17 and $26), January 2025 (at $25), and significantly increased their holdings after the bounce from $12 on March 15, 2025. They currently hold a total of 66 million LINK with an average cost of $14.6;
The latter group consistently increased their holdings; they added to their position in December 2024 to January 2025 (as the price dropped from $29 to $19), February 2025 (as the price dropped from $25 to $14), and at the low point on March 11, 2025. They currently hold 21 million LINK with an average cost of $16.
This behavior indicates that these whale groups are patient long-term holders unlikely to sell at the current price level. Therefore, the $14.6 and $16 levels are not resistance but rather chip support. If the LINK price continues to decline, it is possible that these two whale groups may continue to accumulate.
Combining the aforementioned information, with Line 1 at $15 and Line 3 at $10, the collective accumulation by whale groups suggests that any pullback in the LINK bull market is likely to find a temporary bottom within that range.
My sharing is for learning and communication purposes only, not as investment advice
You may also like

The Impossible Triangle of DeFi Lending

Bitcoin ETF News: Why Bitcoin Is Falling Even After $2.43B ETF Inflows in April
Bitcoin ETF news today shows $2.43B in April inflows as institutions absorbed thousands of BTC, yet the price dropped from $79K to $76K. Traders are now watching whether the $80K resistance breaks or triggers another pullback.

What Is RWA in Crypto? Real-World Assets Explained (2026 Guide)
What Is RWA in Crypto?RWA stands for Real-World Assets — traditional financial assets like bonds, real estate, gold, and private credit that have been converted into blockchain tokens.

Revisiting RWA: Nearly 50,000 people's first on-chain transaction was not Bitcoin, but stock indices and crude oil

Altcoin Price Outlook 2026: The Rotation Is Coming — Just Not the Way You Think
Bitcoin dominance at 58%, Fear & Greed at 39. If you think altcoin season is dead, you're reading the wrong signals. Here's what the data actually says about what comes next.

Oracle: The Second Battlefield Behind the Prediction Market War

a16z's key bet: Kalshi's weekly trading volume approaches $3 billion, transitioning from "prediction games" to financial infrastructure, the market begins to price "uncertainty."

Morning Report | Galaxy Digital announces Q1 2026 financial report; Liquid completes $18 million Series A financing; Polymarket plans to bring major exchanges to the U.S

From a banned economist to the new CEO of Xinhua: Fu Peng has figured out the second half of traffic

Why Private Credit Became the First True Bridge from TradFi to DeFi

Senior cryptocurrency investor: Blockchain is showing a siphoning effect on capital

When traditional crypto derivatives start to subtract: Insights from Hyper Trade's products

My view on blockchain has changed

Will AI Agents use bank cards? Why can't Agentic Payment avoid stablecoins and blockchain?

Deconstructing 80 mainstream payment institutions and wallets worldwide
The MiCA Fast Track for Cryptocurrency Licenses: Why OKX and BVNK Choose Malta
a16z Crypto: Stablecoins are rebuilding the global financial infrastructure
ENI's RWA ambition: to create an enterprise-level BaaS platform that allows Web2 institutions to "go beyond just asset on-chain."
The Impossible Triangle of DeFi Lending
Bitcoin ETF News: Why Bitcoin Is Falling Even After $2.43B ETF Inflows in April
Bitcoin ETF news today shows $2.43B in April inflows as institutions absorbed thousands of BTC, yet the price dropped from $79K to $76K. Traders are now watching whether the $80K resistance breaks or triggers another pullback.
What Is RWA in Crypto? Real-World Assets Explained (2026 Guide)
What Is RWA in Crypto?RWA stands for Real-World Assets — traditional financial assets like bonds, real estate, gold, and private credit that have been converted into blockchain tokens.
Revisiting RWA: Nearly 50,000 people's first on-chain transaction was not Bitcoin, but stock indices and crude oil
Altcoin Price Outlook 2026: The Rotation Is Coming — Just Not the Way You Think
Bitcoin dominance at 58%, Fear & Greed at 39. If you think altcoin season is dead, you're reading the wrong signals. Here's what the data actually says about what comes next.
