On-Chain Data School (Part Four): Visualizing BTC UTXO Age Price Distribution Chart
Original Article Title: "On-chain Data Classroom (Part 4): Visualizing the $BTC Chip Price Distribution Chart "
Original Article Author: Mr. Berg, On-chain Data Analyst
This article is the 4th in the On-chain Data Classroom series, which consists of 10 articles in total. Take you step by step to understand on-chain data analysis. Interested readers are welcome to follow this series of articles.
Related Reading: "On-chain Data Classroom (Part 3): Have the Bottom Fishing Whales Taken Profit?"
TLDR
- This article will introduce the on-chain metric URPD
- URPD shows the distribution of $BTC chips at different holding costs
- URPD can be used to observe chip turnover, distribution conditions, and provide guidance on trends
What is URPD?
URPD, short for UTXO Realized Price Distribution.
Due to BTC's unique UTXO blockchain structure,
we can track data on-chain that is unavailable in traditional financial markets.
The URPD chart is an indicator derived from this principle,
where we can see the number of chips corresponding to each price level on the chart,
equivalent to showing the "buying cost of each $BTC."
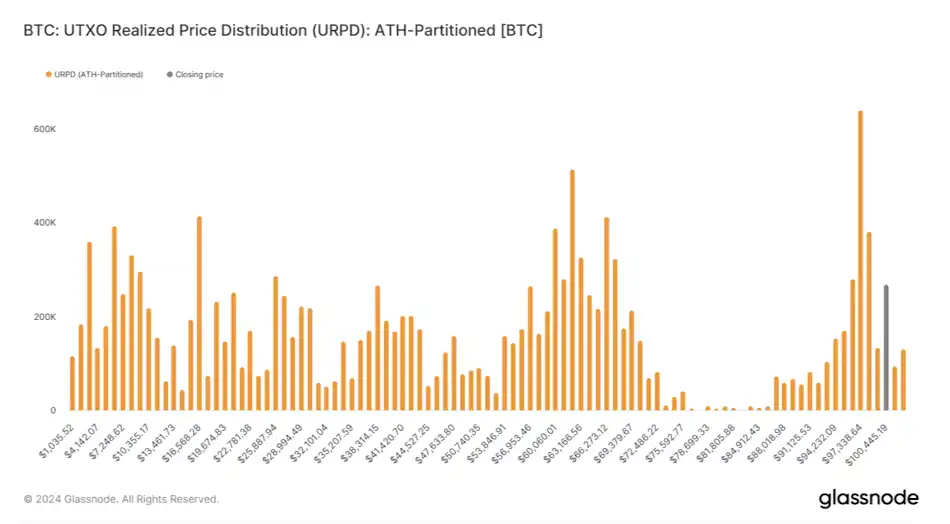
URPD, Chip Turnover, Accumulation, and Distribution
After understanding the concept of URPD,
we can then observe the turnover of chips at different price levels based on the daily URPD changes.
For example:
Chart one below is the URPD chart for May 1,
while chart two is the URPD chart for October 1.
After experiencing five months of wide-ranging fluctuations in price,
It is quite obvious to see the phenomenon of low-cost chips being distributed upwards.

URPD, Chip Turnover, Accumulation, and Distribution (2)
In history, at a market top, it is usually accompanied by the tail end of high-profit low-cost chip distribution;
while at a market bottom, a large amount of chips can be seen accumulating in a relatively narrow range.
Therefore, in analysis,
URPD is often observed together with other data (such as realized profit, MVRV, etc.),
integrating logical thinking to understand the market from a more comprehensive perspective.

Support, Resistance, Consensus
When a significant amount of chips begins to accumulate in a single price range,
it indicates that a supply-demand consensus has gradually formed in that range.
Once the price later rapidly rises out of that range,
due to the high turnover of chips in that range,
it is likely to provide support in the future;
Conversely, if the price falls below that range,
the chips in that range will become trapped chips,
which may act as resistance levels in future price increases.
Conclusion
The above is all the content of On-Chain Data School (Part Four). For readers interested in delving deeper into on-chain data analysis, remember to keep track of this series of articles!
If you want to see more analysis and educational content on on-chain data, feel free to follow my Twitter handle (X)!
Hope this article has been helpful to you. Thank you for reading.
You may also like

The Rise of Composable RWA

MAGA Up 350% in 24 Hours, PEPE Up 46% in One Day: Which Memecoins Are Next in 2026?
MAGA +350% in 24hrs. PEPE +46% in one day. RAVE +4,500% then -90%. In 2026's memecoin market, the gains are real. So are the traps? Here's how to tell the difference before you buy.

RCD Espanyol vs Real Madrid: Can the Pericos Delay the Inevitable?
RCD Espanyol vs Real Madrid lineups, standings, and stats for May 3, 2026. Real Madrid visits RCDE Stadium as Barcelona closes in on the LALIGA title. Full preview inside.

MegaETH goes live with an FDV exceeding 2 billion USD. Which ecological projects are worth paying attention to?

Dialogue with "Wood Sister" Cathie Wood: The next bull market is about to arrive

Can prediction markets win the competition for perpetual contracts?

Who is trading on Trade.xyz?

Binance quietly placed a bet on a leading large model company

Best Crypto Discord Server 2026: Why Jacob’s Crypto Clan Is Gaining Massive Attention
Jacob’s Crypto Clan has grown into one of the most active crypto Discord communities, with over 45K members and continuing to expand. This rapid growth reflects strong demand for structured trading insights and real-time collaboration.

Tom Lee Buying ETH: Why Wall Street’s Loudest Ethereum Bull Keeps Doubling Down
Tom Lee keeps buying ETH through every dip, every drawdown, and every moment of market doubt. Inside the strategy that's turning Ethereum into a treasury asset — and what it signals for the rest of the market.

Stripe Sessions 2026: AI Agent, Global Payments, and Invisible Crypto Infrastructure

Where will South Korea's cryptocurrency taxation head?

Legendary investor Naval: Apple is dead, SaaS will follow suit, and entrepreneurs have 18 months to reshape their moats

Morning Report | Visa includes Polygon in its global stablecoin settlement program; MoonPay invests $100 million to acquire security company Sodot; Digital wallet platform Belo completes $14 million Series A financing

Full text of the Federal Reserve's decision: Holding steady for the third consecutive time but increasing divisions

Dan Bin takes action, building a position in Circle
The Impossible Triangle of DeFi Lending

Bitcoin ETF News: Why Bitcoin Is Falling Even After $2.43B ETF Inflows in April
Bitcoin ETF news today shows $2.43B in April inflows as institutions absorbed thousands of BTC, yet the price dropped from $79K to $76K. Traders are now watching whether the $80K resistance breaks or triggers another pullback.
The Rise of Composable RWA
MAGA Up 350% in 24 Hours, PEPE Up 46% in One Day: Which Memecoins Are Next in 2026?
MAGA +350% in 24hrs. PEPE +46% in one day. RAVE +4,500% then -90%. In 2026's memecoin market, the gains are real. So are the traps? Here's how to tell the difference before you buy.
RCD Espanyol vs Real Madrid: Can the Pericos Delay the Inevitable?
RCD Espanyol vs Real Madrid lineups, standings, and stats for May 3, 2026. Real Madrid visits RCDE Stadium as Barcelona closes in on the LALIGA title. Full preview inside.
